
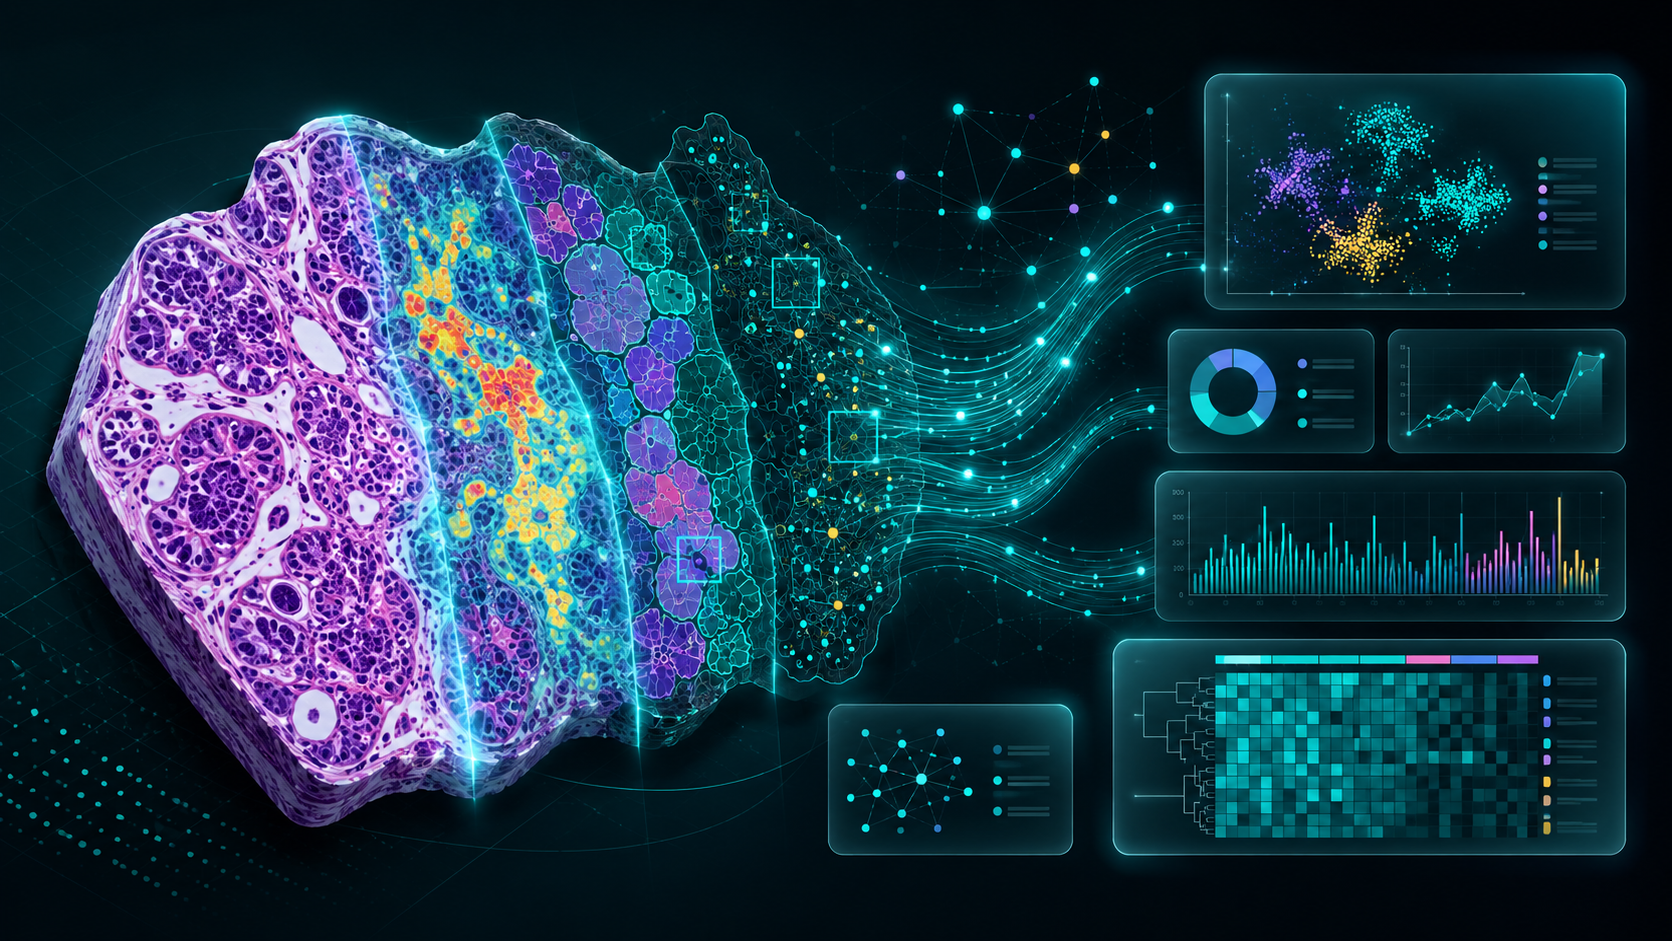
Image Analysis Services
On-Demand.
Advanced image analysis services for histology and histopathology — delivering quantitative, pathologist-validated insights for IHC, multiplex immunofluorescence, and multiplex immunohistochemistry assays — without building an in-house imaging division. You send tissue, slides, or whole-slide images; we return decision-ready data.
Glint Lab delivers 100% of the capability at a fraction of the time and loaded cost of standing up the equivalent in-house.
Deployment Time
weeks to first resultsto results
Total Loaded Cost
USD, per programAnalytical workflows for translational targets
Our image analysis services provide comprehensive workflows for histology and histopathology across IHC, multiplex immunofluorescence (mIF), and multiplex immunohistochemistry assays — from single markers to whole-tissue spatial biology.
Quantitative
Histopathology image analysis for cell counts, area metrics, staining intensity, IHC and multiplex phenotyping, tumor purity, immune infiltration.
Spatial
Multiplex immunofluorescence (mIF) and multiplex immunohistochemistry (mIHC) spatial analysis — clustering, proximity, infiltration, density profiling.
Predictive AI
Histology-based prediction models — mutation prediction, automated IHC scoring, disease and treatment outcome modeling.
A solution built around your study.
Full-Spectrum Service
Integrated histology, pathology, and computational analysis under one roof.
RUO & Regulatory-Ready
Flexible to your study design and quality needs, from exploratory to audit-ready.
Pathologist-Validated
Reproducible, audit-ready, and consistent across platforms and cohorts.
High-value actionable insights for translational programs
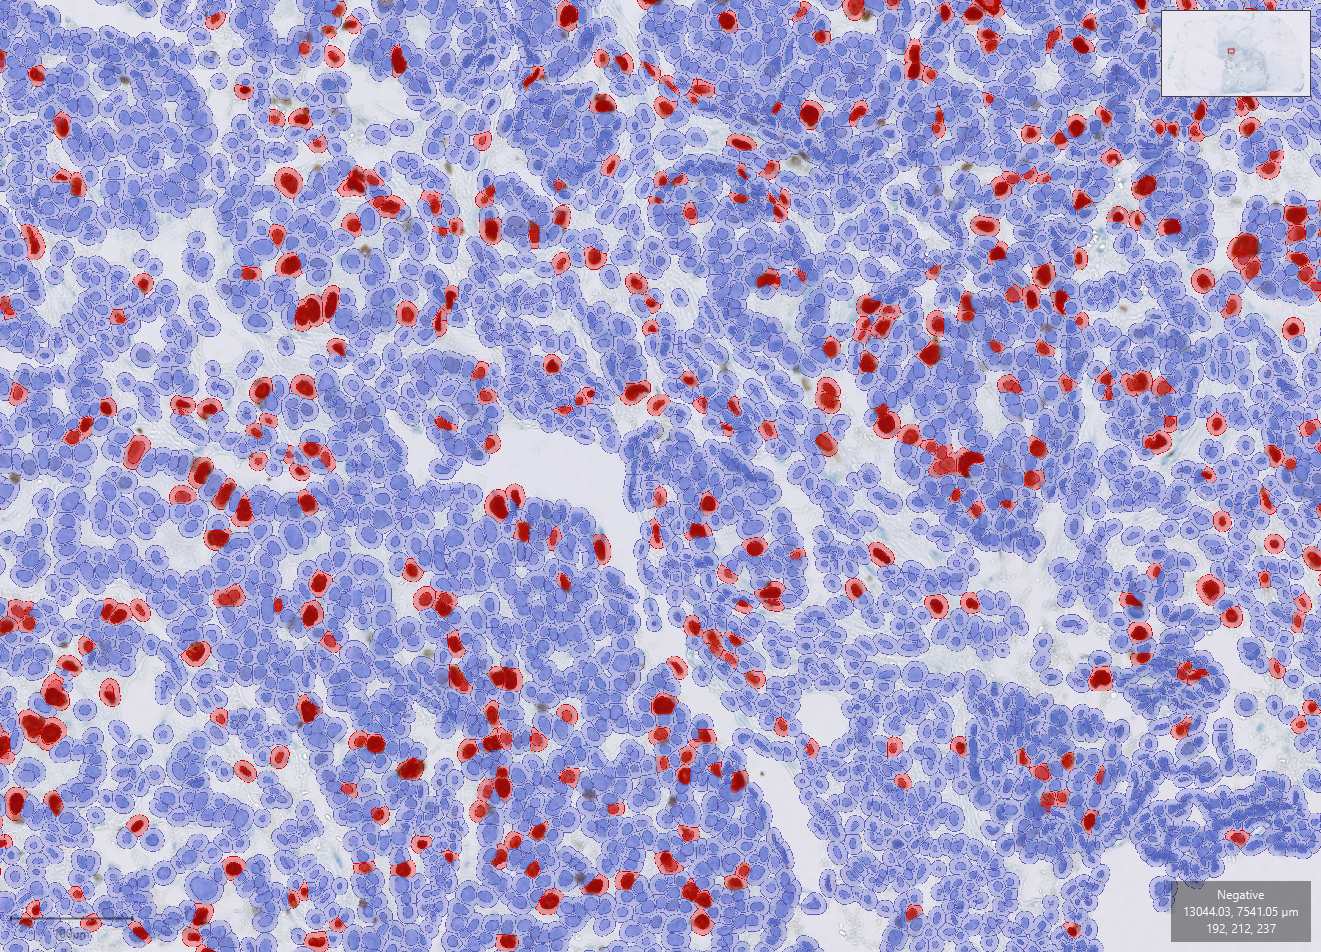
H-Score Automation
H-Score Automation
- H-Score (0–300 scale)
- % positive cells
- Staining intensity
Know exactly how much your target is expressed — eliminating inter-pathologist variability.

Spatial Immune Profiling
Spatial Immune Profiling
- Cell-to-cell proximity metrics
- TME compartment densities
- Immune infiltration classification
Not just which cells are present, but where — revealing resistance & immune exclusion.
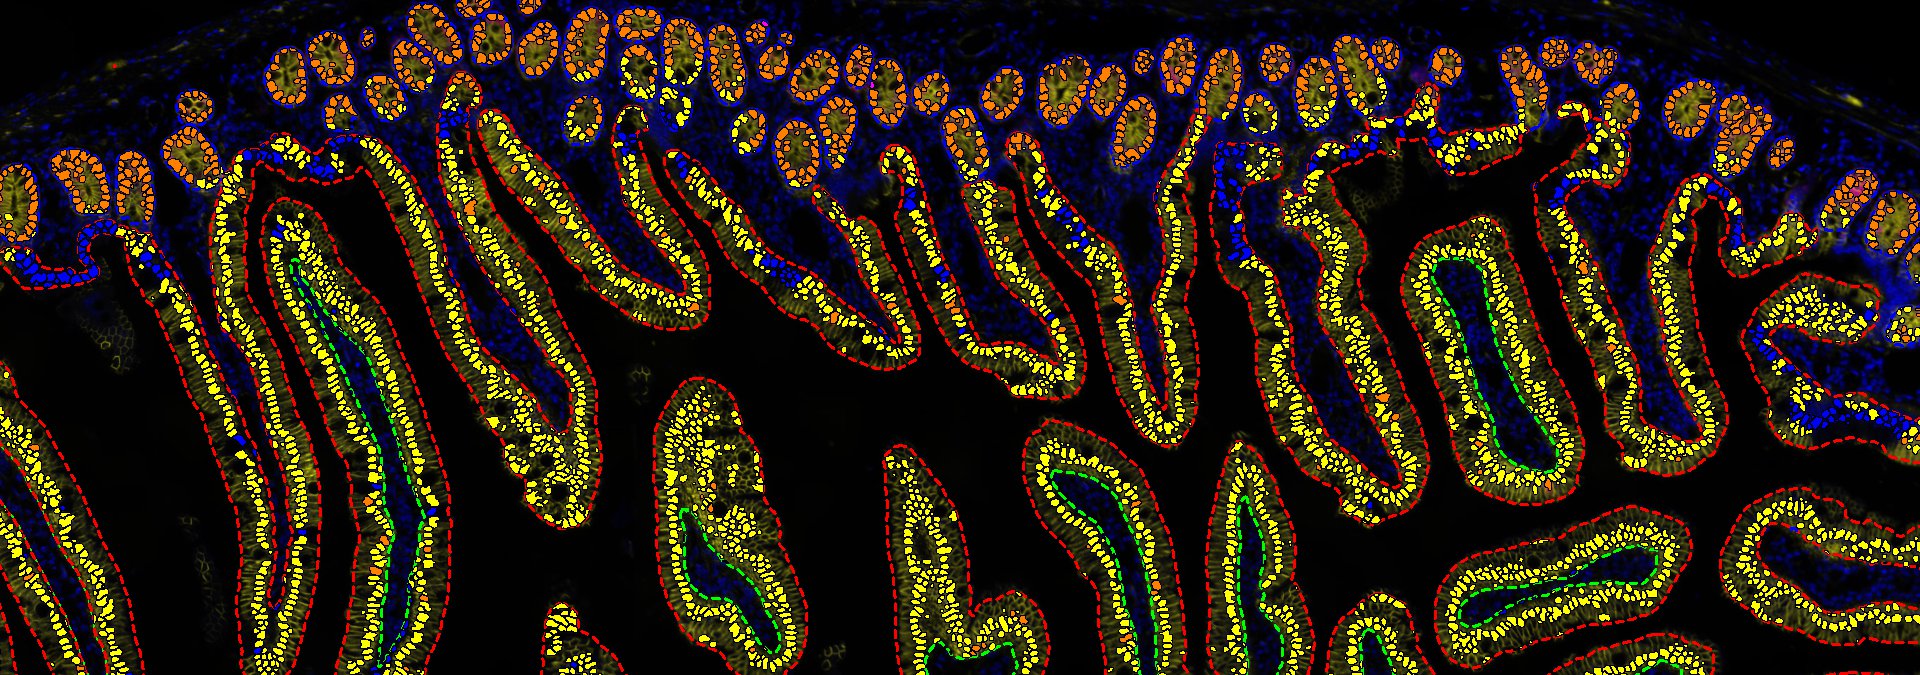
Multiplex IF Quantification
Multiplex IF Quantification
- Multi-marker co-expression
- Neighborhood analysis & clustering
- Per-channel intensity metrics
Characterize every immune population in one section — built for I-O, CAR-T & checkpoint.
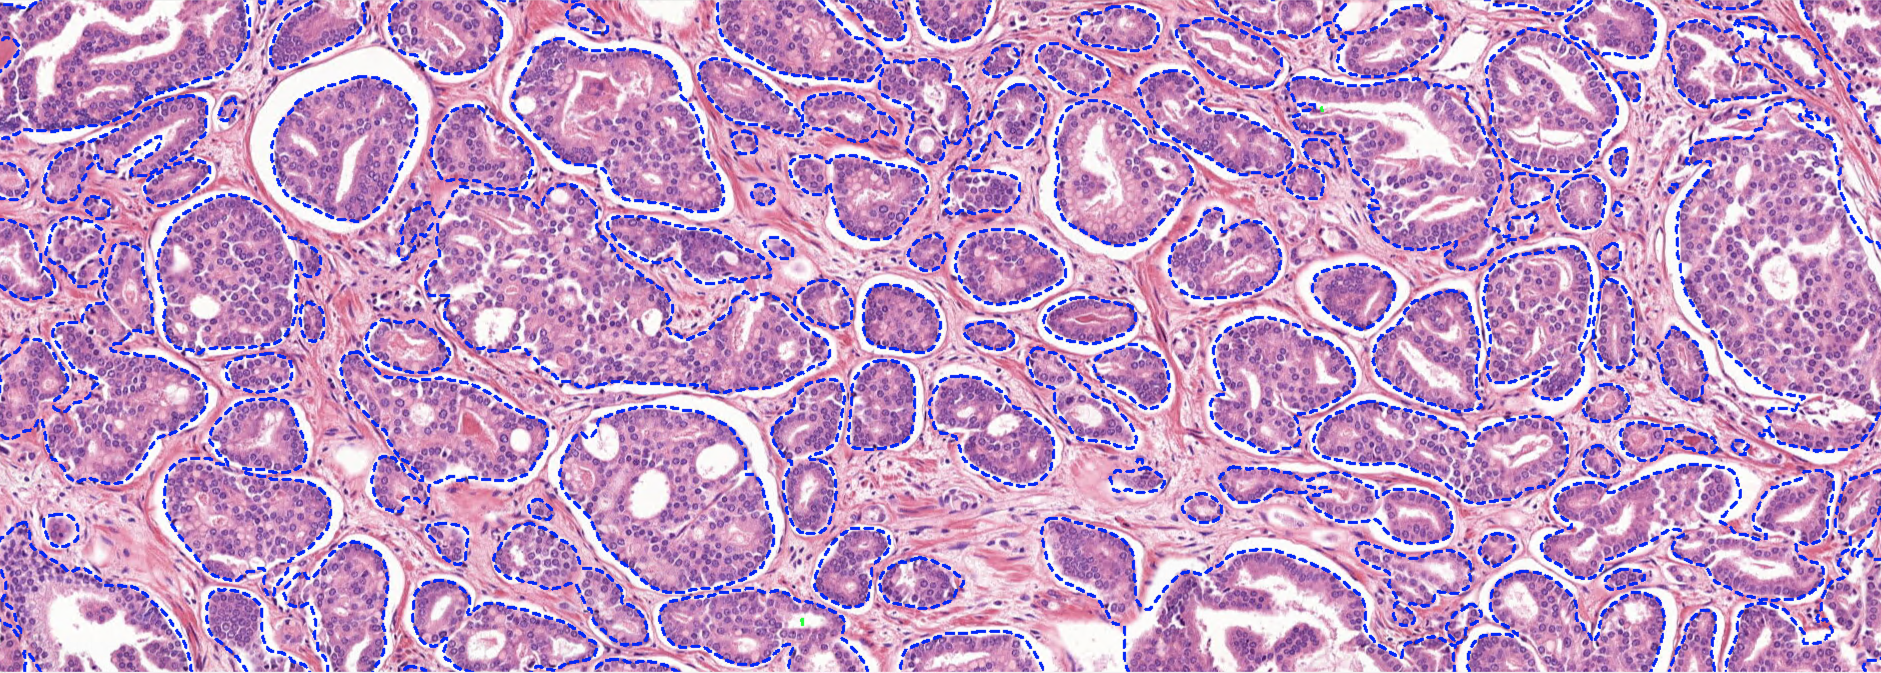
H&E Morphology Analysis
H&E Morphology Analysis
- % tumor area, stroma, necrosis
- Dermal / epidermal thickness
- Immune infiltration scoring
Remove subjectivity from efficacy & safety reads — standardized across every cohort.

Biologics & ADC
Biologics & ADC
- Advanced RNA & protein quantification
- Target assessment & validation
- RNAscope puncta enumeration
De-risk biologic and antibody-drug-conjugate programs with quantitative target validation.
↻ Click any card to see the analytical details
Digital pathology, turned into quantitative biology
Comprehensive quantitative outputs for open-ended exploration, backed by pathology experts.
Quantification
Positive cell counts, area, %, density & intensity — IHC, IF & special stains.
Uneven staining, blur, folds, background — objective pass/fail.
Compartment mapping: membrane, cytoplasm, nucleus.
Multi-marker phenotyping in heterogeneous tissue & TME.
Binned dot counts per cell.
Scoring & Morphology
Intensity-weighted scoring for standardized cohort comparison.
Epidermal thickness, layer identification, cross-sectional analysis.
Fiber type, area, diameter, centralized nuclei — regeneration & degeneration.
Fiber length, branching, orientation & anisotropy, fibrosis quantification.
NMJ morphology, microneedle penetration-site identification.
Tissue Context & QA
Tumor, stroma, dermal / epidermal layers, TLS, and more.
Steatosis (micro / macro droplets) & immune-cell infiltration density.
Detect, count & measure metastatic burden.
NASH, OARSI, Ashcroft, Ishak, and more — automated & objective.
Cross-reagent & cross-platform assay validation.
A deep repository of image-analysis algorithms
Spanning oncology, neuroscience, fibrosis, dermatology, muscle, and metabolic disorders — off-the-shelf or custom-trained.
Anchored in full-service histopathology: IHC (100+ antibodies) · multiplex IF · RNAscope · special stains · whole-slide imaging
Actionable insights you can publish and defend
Our image analysis services deliver comprehensive documentation, graphs, and visualizations from histopathology and multiplex immunofluorescence assays — built for reproducibility and informed decisions.
- Publication-ready graphs: high-resolution plots of distribution, density, and positive-percentage trends.
- Pathology integration: results aligned and reviewed alongside pathologist analysis.
- Complete metadata audit trails: full documentation of pipeline logic for end-to-end traceability.
- Tissue microenvironment matrices: spatial layouts mapping absolute metrics and proximity relationships.
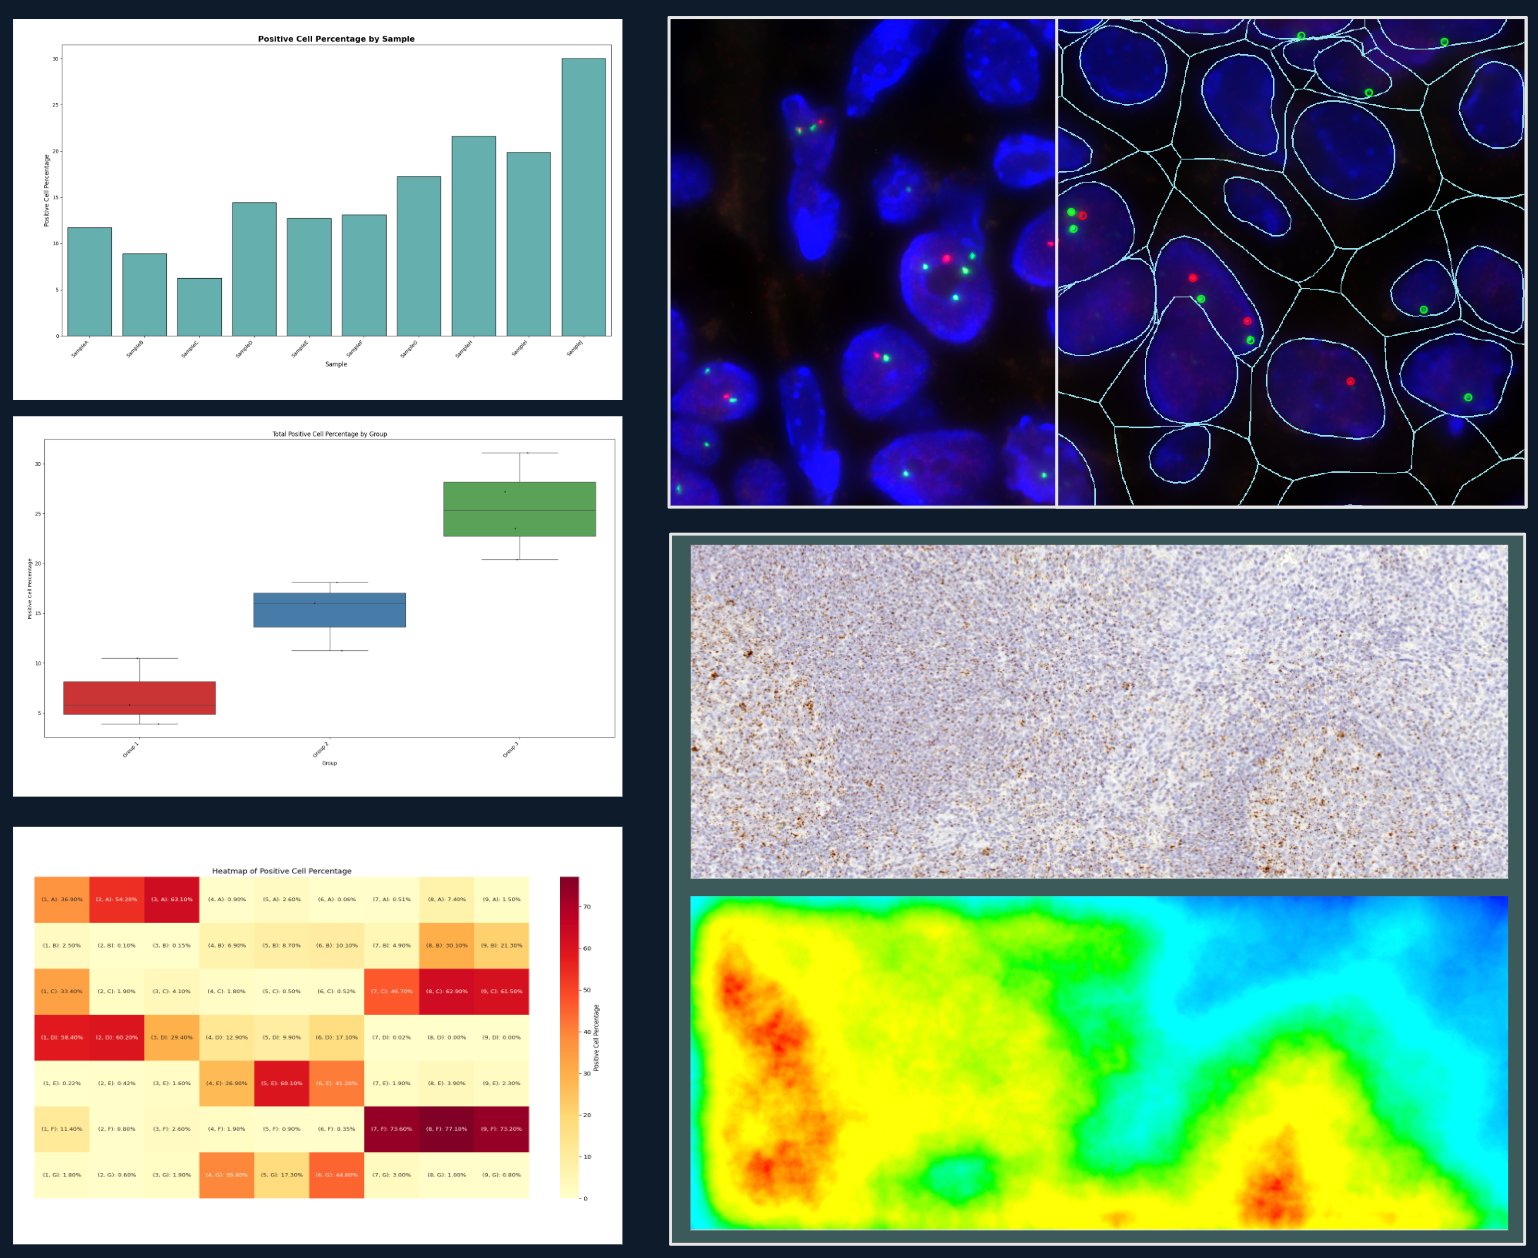

Study charts, histograms & spatial heatmaps in every report
From samples to a final report in four steps
Consult
We start with your tissue samples, glass WSIs, and research goals.
Assay / Panel
We scope the assay panel and analysis workflow together with you.
Analyze
We develop and deploy novel algorithms or fine-tune existing ones.
Deliver
Quantitative data tables, visualizations, and a final report.
Image analysis services: Common technical & engagement questions
Initial calibration of artifact controls, signal-to-noise distributions, and cellular alignment targets.
Cross-cohort model checking and rigorous edge testing against hidden or variable sample anomalies.
Zeiss (`.czi`, `.lsm`), Leica (`.scn`), Olympus (`.oib`, `.vsi`), Nikon (`.nd2`), Aperio (`.svs`), Hamamatsu (`.ndpi`), Ventana (`.bif`), 3DHistech (`.mrxs`), Philips (`.isyntax`), Akoya / PerkinElmer (`.qptiff`)
OME-TIFF (`.ome.tif`, `.ome.tf8`), TIFF/TIF, JPEG/JPG, and BMP
Partner with Glint Lab
Get AI-driven image analysis services for publication-ready, quantifiable insights — from study design through final report. No imaging division required.